← All projects · Computer Vision · AI Engineering
3D Vision
Muhammad Hammas · AI Engineer · Master's in Artificial Intelligence
Depth, surfaces, normals, registration and novel views. Classical methods and learned ones, measured against ground truth that is known in closed form or planted on purpose. 10 projects.
ICP registration
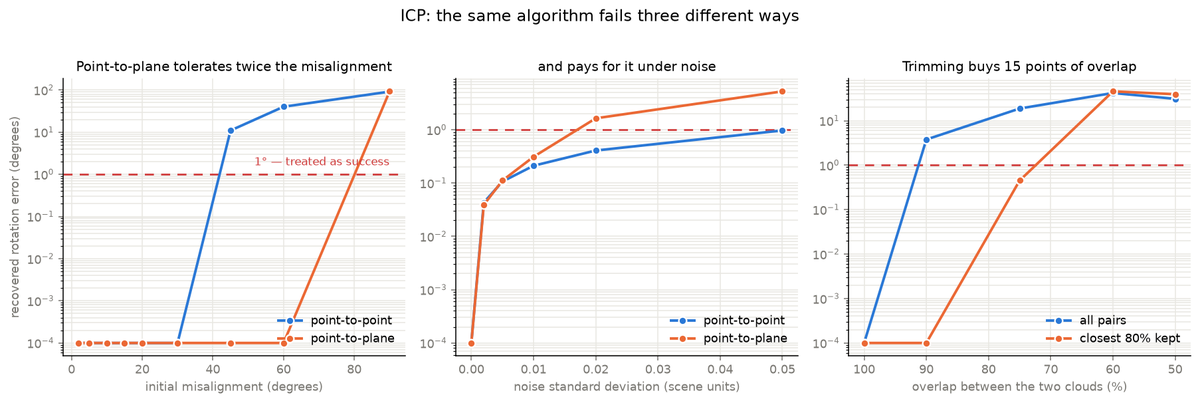
Point-to-plane tolerates twice the misalignment
Show the resultThe convergence basin is 30° for point-to-point and 60° for point-to-plane — exactly double. Past its basin ICP does not fail loudly; it converges confidently to the wrong alignment, which is why a residual cannot be used to detect the failure.
shape three fused blobs, 2,000 points — asymmetric, so rotation is unambiguous ground truth a known rigid transform; error is the geodesic angle to it varied initial misalignment, noise, overlap, trimming success recovered rotation within 1° 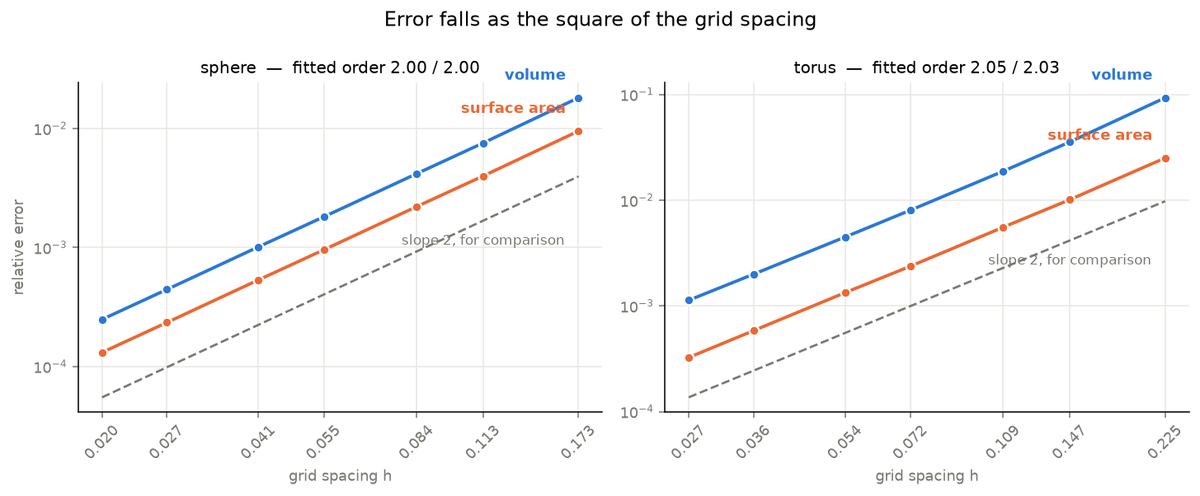
Marching cubes
The error is exactly second order, and that fixes the cost
Show the resultFitting
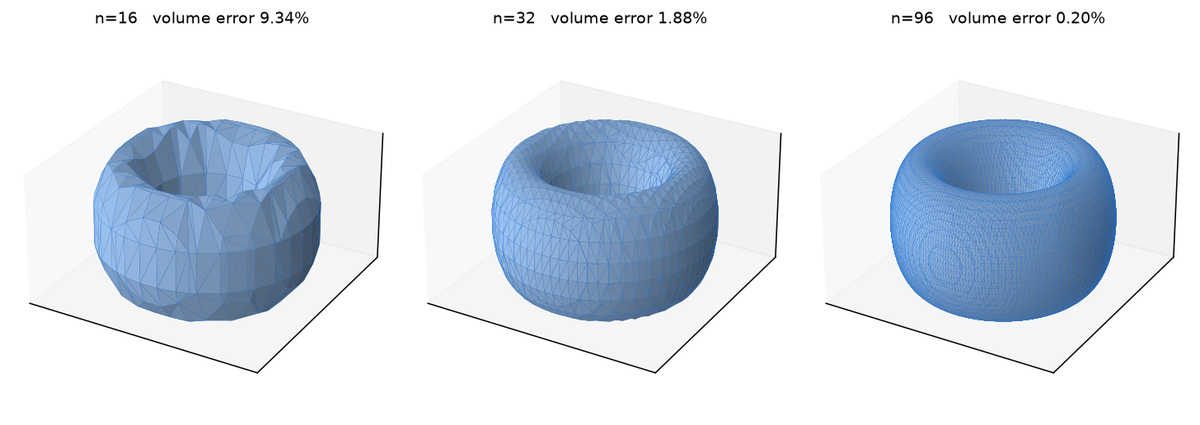
log(error)againstlog(h)gives the observed order of convergence:All six fits land within 0.05 of 2.00. Halving the grid spacing quarters the error — and costs eight times the memory and roughly six times the time. That is the whole trade, and it means accuracy here is bought at a known, unflattering rate: ten times the time buys about three times the accuracy, not ten.
Vertex distance converging at the same order as volume is the useful check. If the mesh were in the right place but the wrong size, the two would disagree.
ground truth closed form — sphere `4/3·π·r³`, `4·π·r²`; torus `2·π²·R·a²`, `4·π²·R·a` grids 16³ to 128³, seven resolutions variants `lewiner`, `lorensen` measurements volume error, area error, vertex distance to the true surface, time 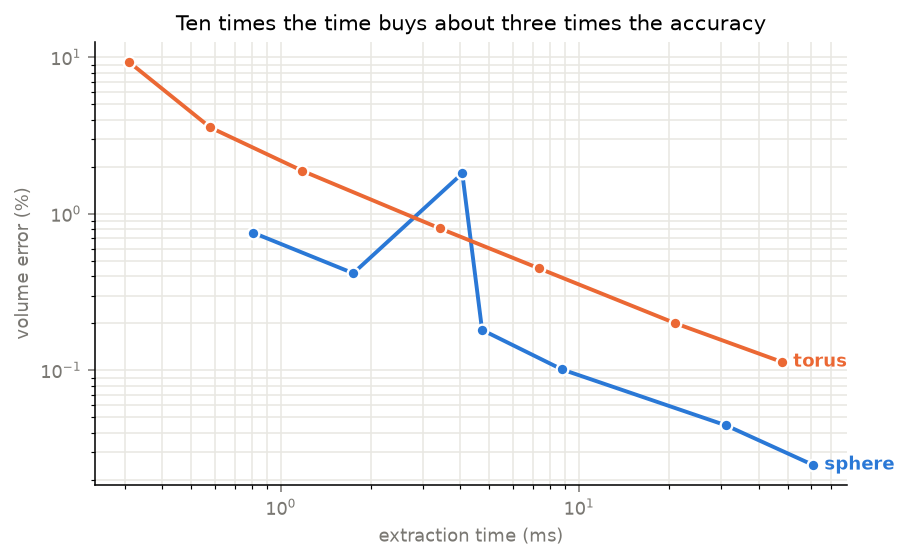
- 28.2354dB PSNR (test)
NeRF: mesh or novel view
Nearly all of the model is the lookup table, and it memorises
Show the resultThe MLP has 9,555 parameters. The hash table has 16.78 million — 1,756× more. So this is not a network that learned a scene so much as a lookup structure that stored one, with a tiny decoder on top.
The train/test gap shows what that costs: 33.592 dB on training views against 28.235 on held-out ones, a gap of 5.357 dB. Rendering from a pose it was fitted on is markedly easier than rendering from one it was not, which is exactly what a memorising representation predicts and what a single training-view render would have concealed.
The per-view spread matters as much as the mean. The worst held-out view scores 18.933 against a best of 34.242 — a range of 15.3 dB on the same trained model. A single averaged PSNR hides that some viewpoints are reconstructed far worse than others.
split PSNR test 28.2354 - Monocular depth
Monocular depth
The alignment protocol moves the score more than the model does
Show the resultDepth Anything V2 is a relative depth model — affine-invariant in disparity, meaning it recovers depth ordering up to an unknown scale and shift. The protocol most write-ups reach for, median-scaling in depth space, fits only the scale and leaves the shift unmodelled.
Both columns below score the same predictions:
δ Reported under the wrong protocol, this model looks roughly half as good as it is, and the number would read as a fact about the model rather than about the measurement.
The fitted disparity transform is reported rather than hidden, because it is the thing a single image cannot determine: scale 0.0848 (sd 0.03078), shift 0.25174 (sd 0.09518).
That shift standard deviation, 0.09518, happens to equal
abs_relto five decimals. It is a coincidence, not a copied field: the run computes and prints the fit statistics on a separate path from the metrics, and the log reports them independently.images 654 — the complete official NYU v2 test split ground truth measured depth, uint16 millimetres evaluation range 0.01–10.0 m, the NYU convention raw model output disparity — determined empirically, Spearman +0.9052 against ground-truth disparity (from the run log), not assumed 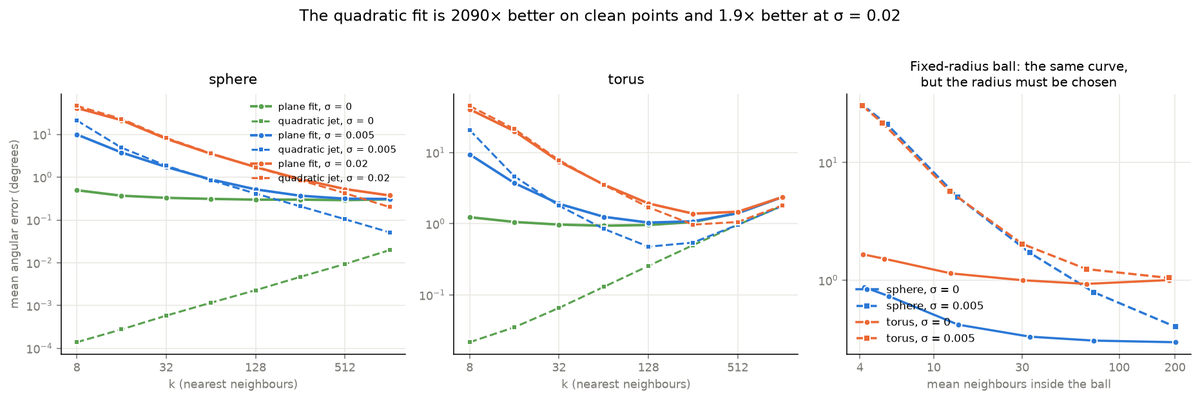
Normal estimation
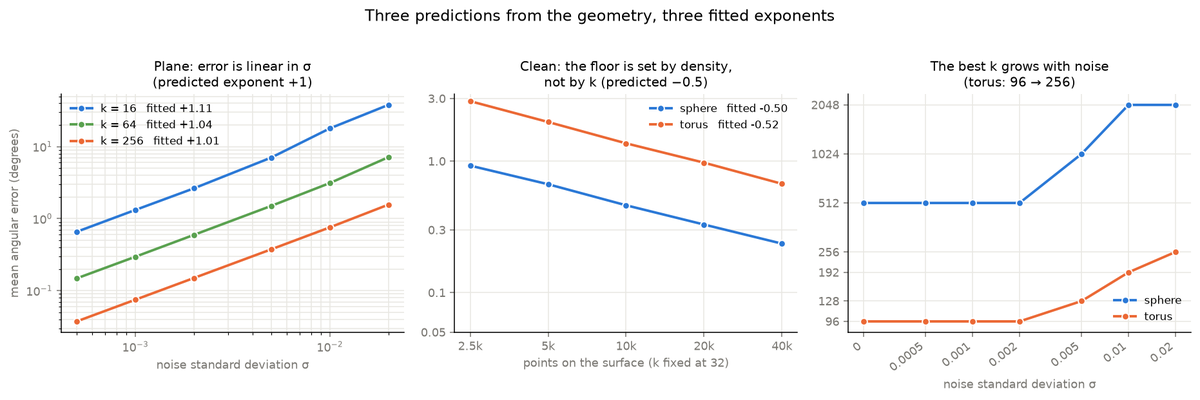
Three predictions from the geometry, three fitted exponents
Show the resultEach regime has an exponent that follows from the geometry rather than from the data, so the run either reproduces it or contradicts it.
surfaces plane (zero curvature), sphere (curvature 1.0), torus tube (curvature 2.857) ground truth analytic normals; error is the unsigned angle, so an unoriented PCA direction is scored fairly swept k from 4 to 2048, σ from 0 to 0.02, 2500 to 40000 points estimators PCA over k nearest · PCA over a fixed-radius ball · quadratic (jet) fit 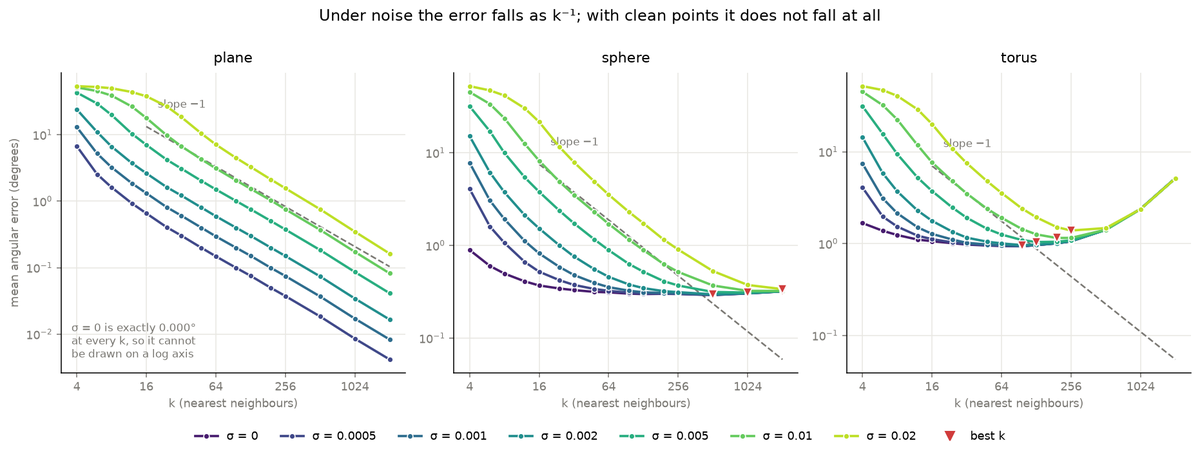
Point cloud decimation
The metric usually quoted is the one that cannot tell these apart
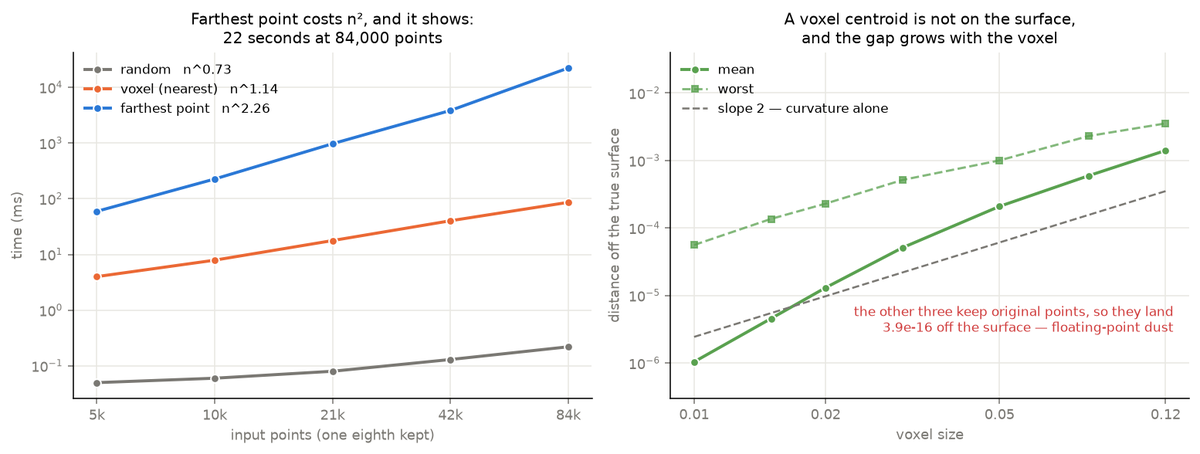
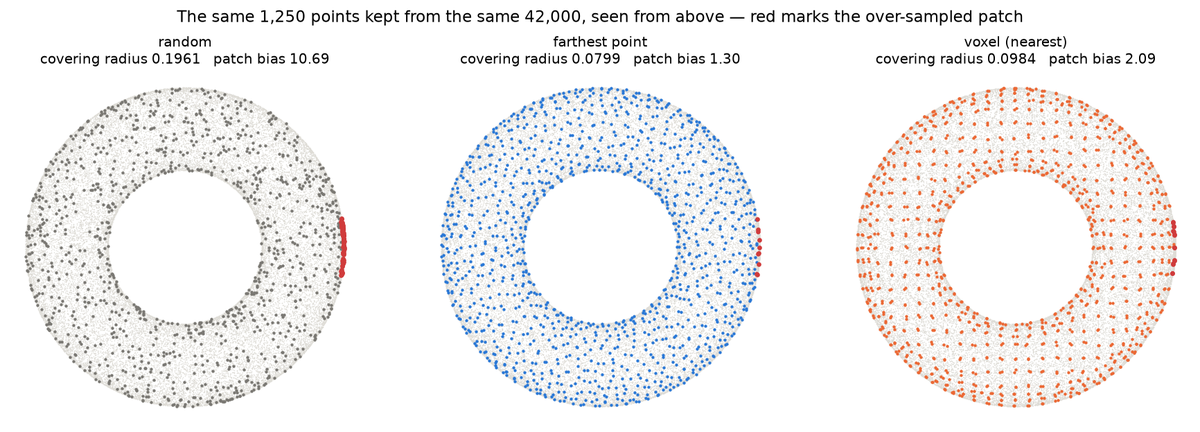
Show the resultChamfer distance back to the original cloud is what decimation is normally scored on. Across every matched count, the spread between the best and worst method on that metric is between 1.24× and 1.87×. On covering radius — the largest distance from any original point to its nearest kept point — the same four methods differ by up to 3.28×, and on density bias by nearly 10×.
Chamfer is a mean over every point, so a handful of badly served regions barely move it. The covering radius is the worst case, and the worst case is what decides whether a later surface fit, normal estimate or collision test has anything local to work with.
cloud 42000 points on a torus (R = 1, a = 0.35), of which 2222 lie in an over-sampled patch planted ground truth the patch's area is `a·2wu·(R·2wv + a(sin(v0+wv) − sin(v0−wv)))` = 0.08482102920624893, a 0.61% share of the surface; the input holds 5.2904761904761906% of its points there, a bias of 8.618248400757404 measured Chamfer back to the original, covering radius, distance off the true surface, density bias, wall clock retained 300 to 20000 points, matched across methods by bisecting the voxel size 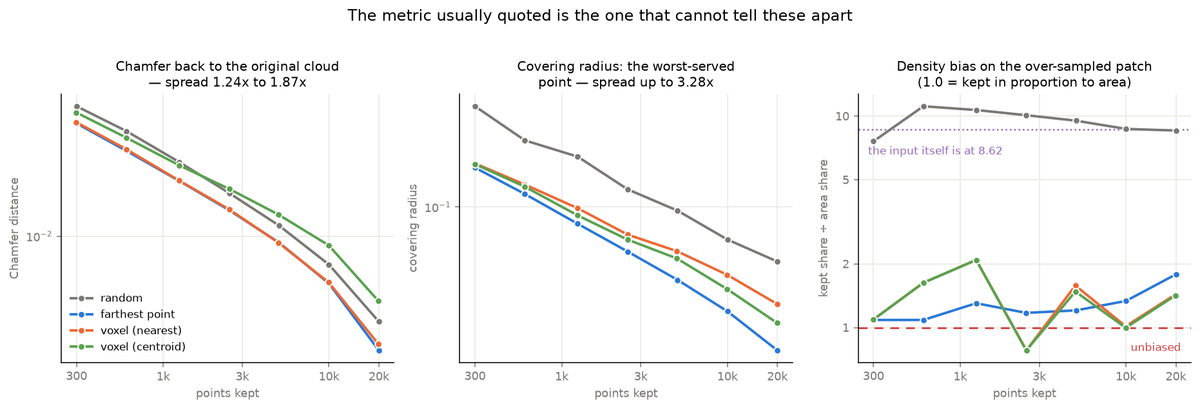
- 0.8254instance mIoU (test)
Point cloud segmentation
The two mIoUs disagree because rare categories are hard
Show the resultInstance mIoU averages over shapes, class mIoU averages over categories. They differ by 0.0552 on test, and the reason is visible once categories are split by how many test shapes they have:
A gap of 0.1233. Class mIoU weights a category with 12 shapes the same as one with 704, so it reports the rare-category difficulty that instance mIoU averages away.
Worst and best on test:
Laptop at 0.9547 with only 83 shapes shows the driver is not sample count alone — a laptop is two near-planar parts with an unambiguous boundary, while a rocket's fins, body and nose meet at boundaries that are genuinely ambiguous. Sample size and intrinsic difficulty both contribute, and this experiment does not separate them.
split instance mIoU train 0.8583 val 0.8516 test 0.8254 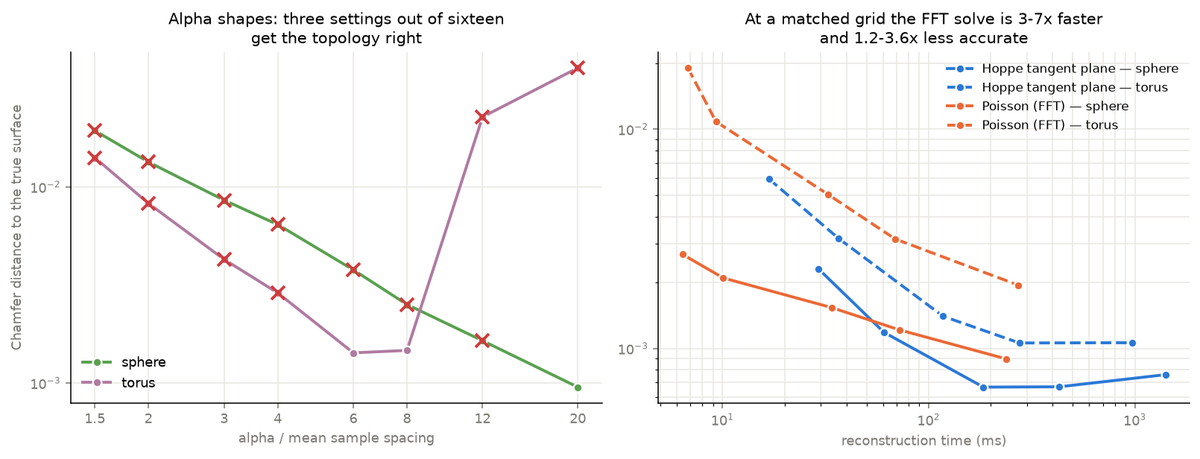
Surface reconstruction
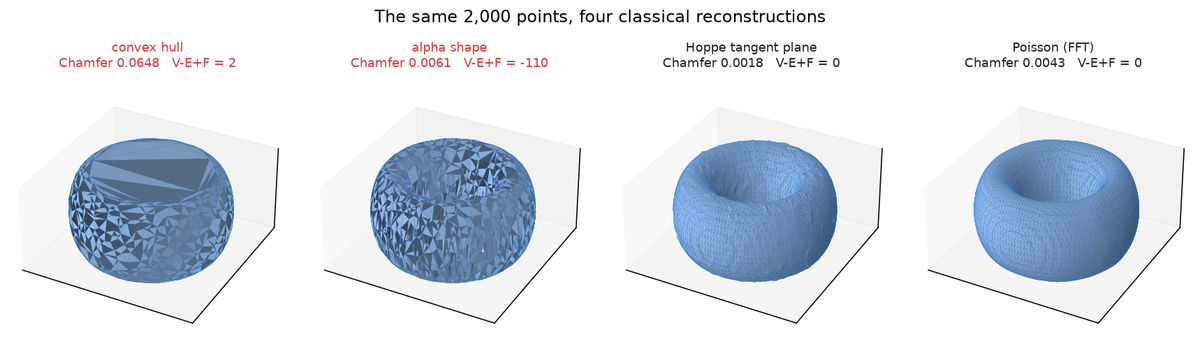
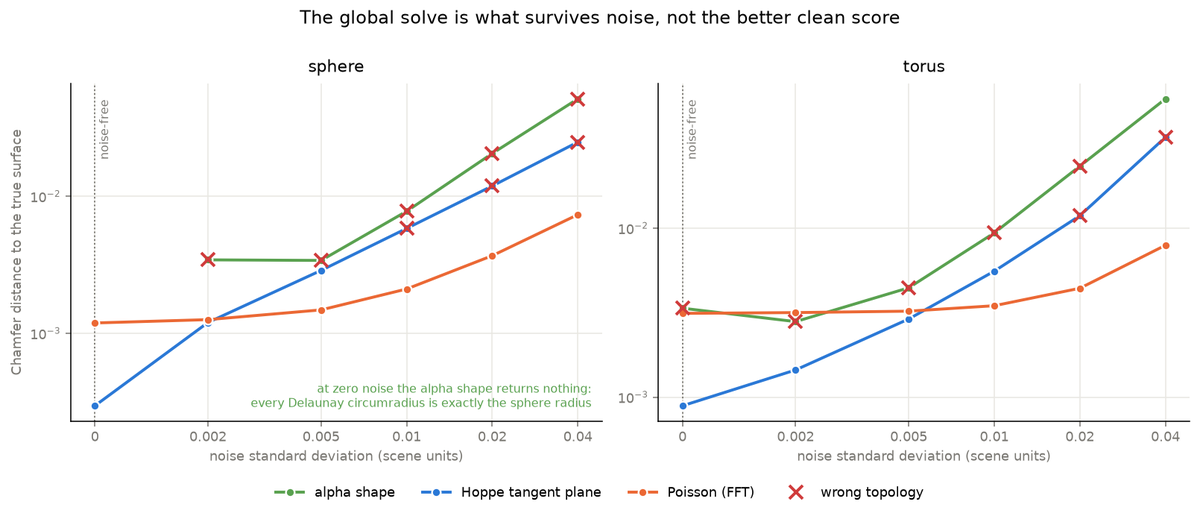
The convex hull is the most accurate method on the sphere and the only one that cannot be fixed on the torus
Show the resultOn a convex surface the hull converges as
n^−1.00— faster than every other method tested, and at 8000 points it is the most accurate of the four (0.00052) while taking 18.1 ms against Hoppe's 782.1 ms.On the torus the same method is stuck at 0.065 and sixteen times more points change it by −4.7%: the fitted exponent is −0.02, which is a flat line with measurement noise on it. Its Euler characteristic is 2 at every size, because a hull has no way to represent a hole. This is the clean case of a method that is not slowly wrong but structurally wrong, and the exponent is how you tell the two apart without looking at a picture.
surfaces unit sphere, torus (R = 1, a = 0.35) ground truth ` methods convex hull · alpha shape (3-D Delaunay) · Hoppe tangent plane · Poisson (FFT) varied 500–8000 points, noise σ = 0 to 0.04, alpha, grid resolution normals estimated by PCA and oriented by spanning-tree propagation — not given 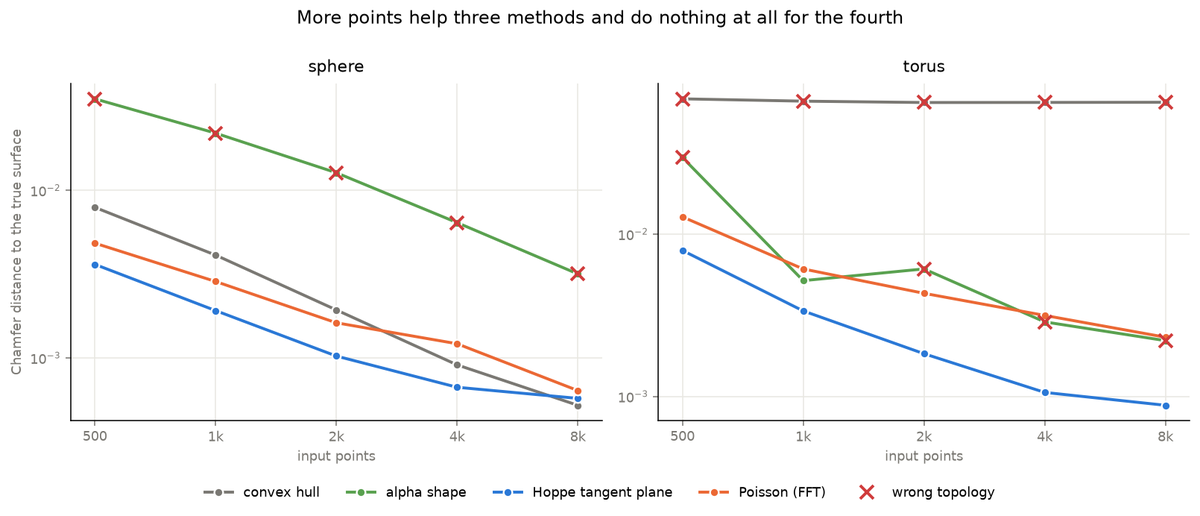
Two-view triangulation
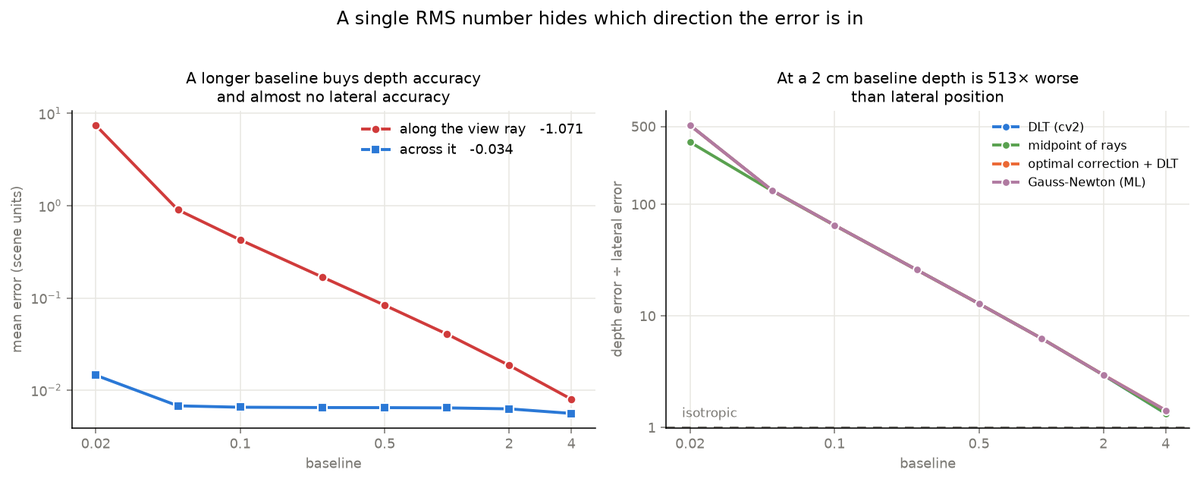
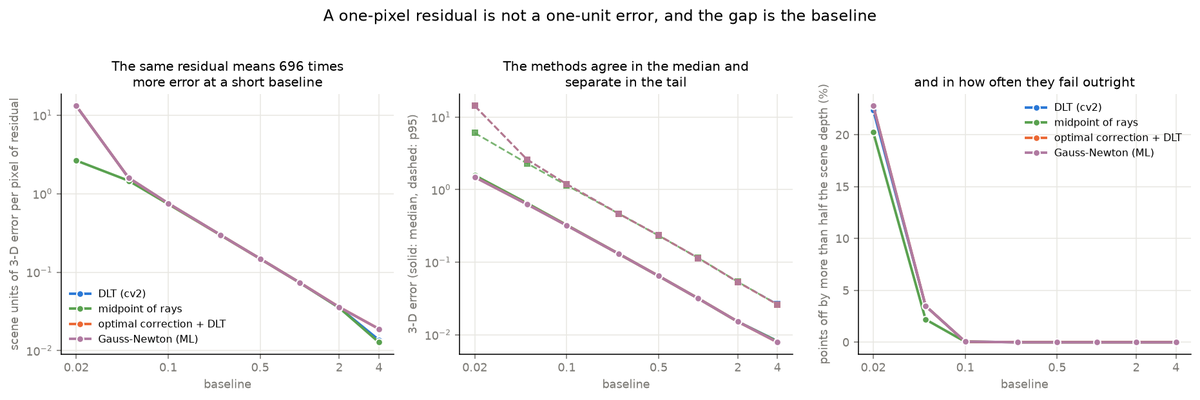
Two predictions from the geometry, two fitted exponents
Show the resultBoth hold to within 1.2%. The baseline fit uses baselines of 0.1 and above: below that the error is a sizeable fraction of the scene depth, points start landing behind the camera and the error saturates instead of growing, so a fit across that boundary would be measuring the saturation.
cameras 1280 × 960, focal length 1000 px, second camera verged on the scene centre scene 2000 points at depths 4.0 to 8.0, mean depth 6 ground truth the 3-D points themselves; only the pixel measurements are perturbed methods `cv2.triangulatePoints` (DLT) · midpoint of rays · `cv2.correctMatches` + DLT · Gauss-Newton on reprojection error (the ML estimate) swept pixel noise σ = 0 to 10 px, baseline 0.02 to 4.0 scene units 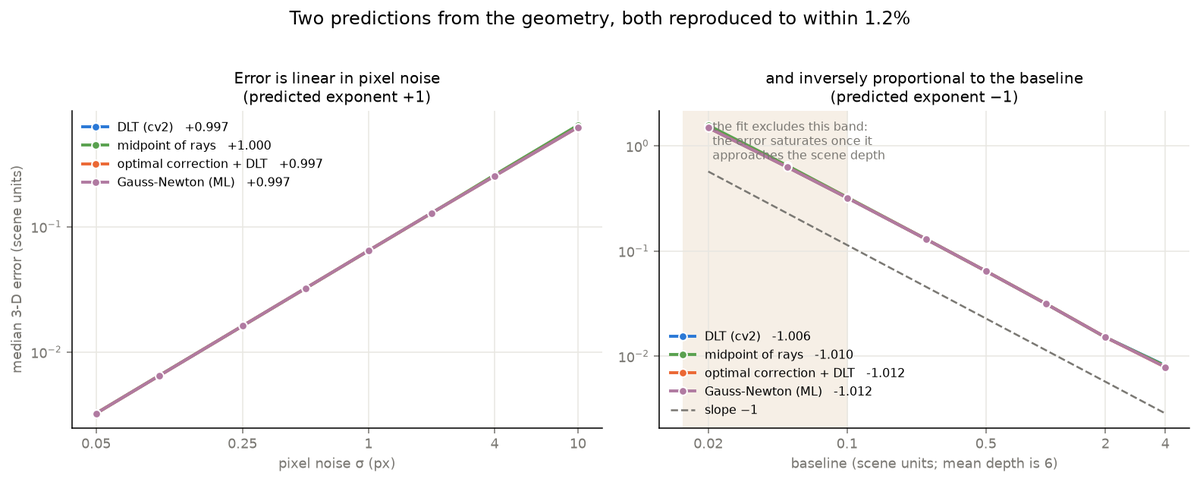
- Volumetric segmentation
Volumetric segmentation
The headline metric is blind to the failure that matters
Show the resultBraTS 2020 is 368 multi-modal brain MRI volumes with three annotated tumour subregions.
On 6 of the 55 test patients the enhancing-tumour Dice is exactly 0.0000 — the model and the annotation share no enhancing voxel at all. The whole-tumour score does not notice:
Whole tumour falls by 0.02. Tumour core falls by 0.40. Five of those six patients still clear the 0.80 whole-tumour bar.
Case 361 is the clearest: a whole-tumour Dice of 0.8735, above the bar, with a tumour core of 0.0322. Whole tumour is the union of all three labels, and that union is dominated by peritumoural oedema — the largest and most separable region. A model can own the oedema and miss the enhancing rim entirely while the headline barely moves.
Had this project reported one number, it would have reported 0.8734 and been wrong about what the model does.
split patients train 258 val 55 test 55